Maryland Coastal Flood Explorer
ESRGC · September 2024 - May 2025
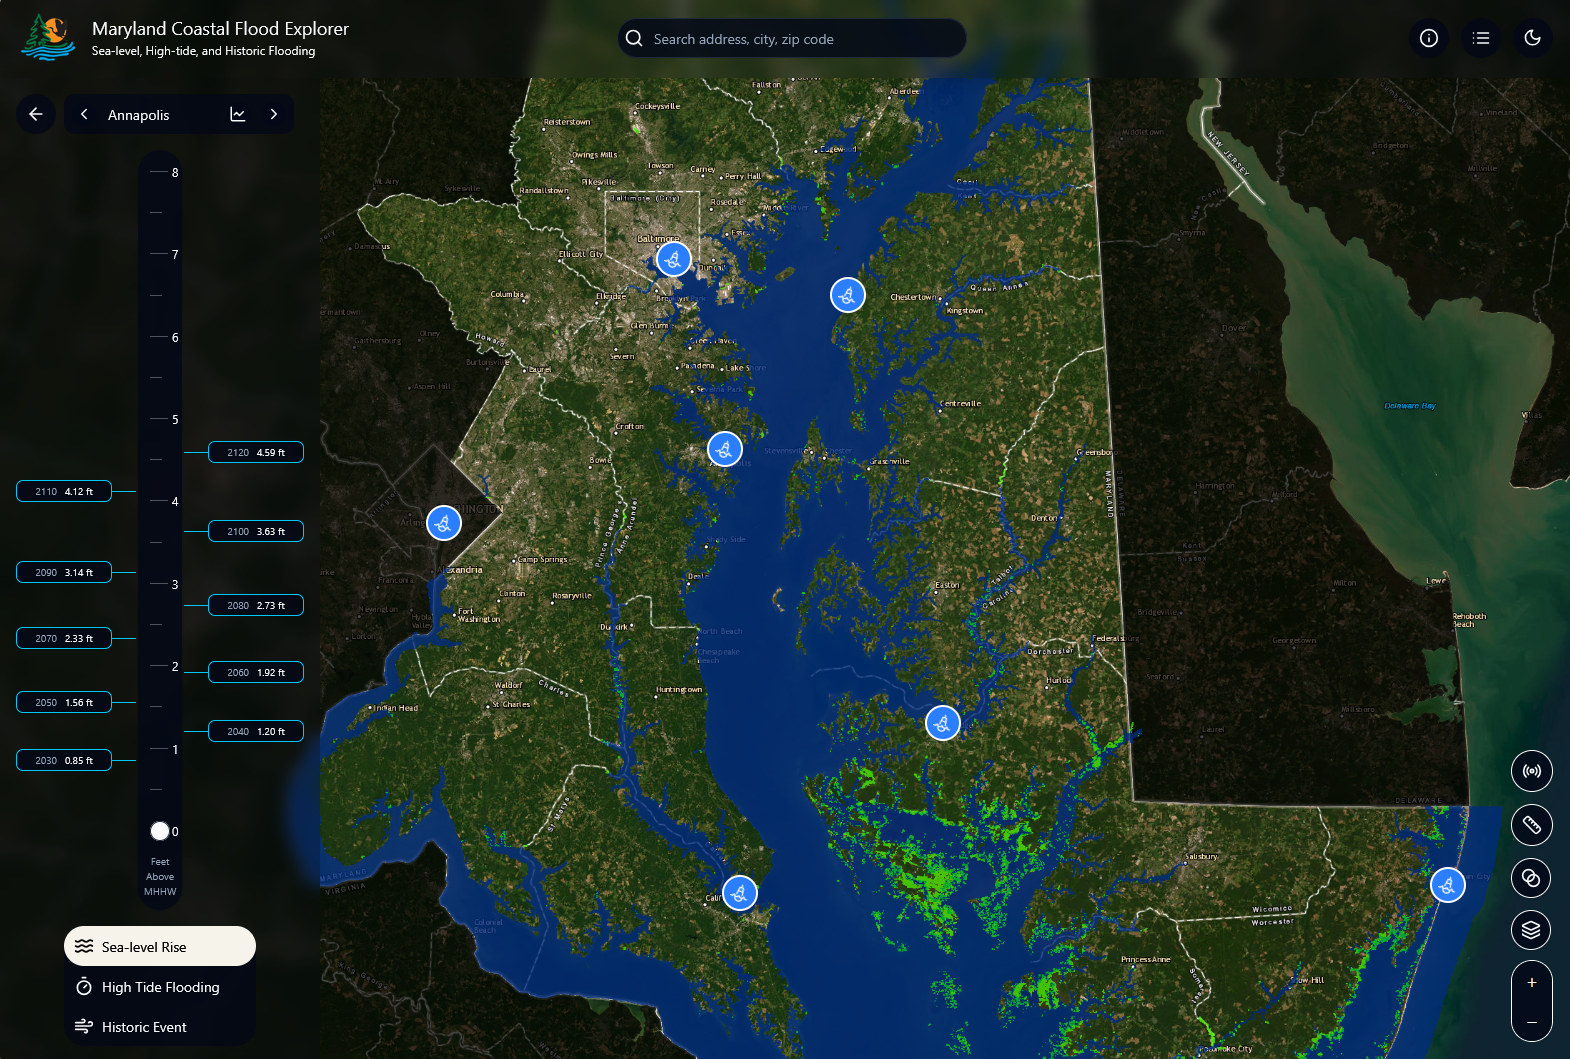
A web map showing potential sea-level rise, high-tide, and historic flooding in the Chesapeake Bay.
Background
The Maryland Coastal Flood Explorer (MCFE) helps residents, planners, and other stakeholders understand how sea-level rise, high-tide flooding, and historic flood events could affect communities around the Chesapeake Bay. The Eastern Shore Regional GIS Cooperative (ESRGC) developed the application for the Maryland Department of Natural Resources (DNR), drawing inspiration from NOAA's Sea Level Rise Viewer and Lake Level Viewer.
DNR wanted the broad accessibility of NOAA's national Sea Level Rise Viewer combined with the more advanced, region-focused tools of the Lake Level Viewer. I led the application's development, translating those goals into an approachable web map tailored to Maryland's coastline and the flood data available for the state.
How it evolved
The first phase established the core sea-level-rise experience. Users could move through inundation layers in six-inch increments from zero to eight feet, adjust their opacity, switch basemaps, search for an address, view a legend, and locate NOAA tide-monitoring stations. I also included dark mode and designed the controls to keep a data-rich map understandable to nontechnical users.
Once that foundation was stable, I added tools for deeper analysis. A dynamic depth-measurement mode reports estimated flood depth based on the selected water level, while separate measurement tools calculate distance and area. Additional reference layers—including parcels, county boundaries, municipalities, and Maryland's Critical Area—help users interpret flooding in a local context. Users can also add their own data through ArcGIS service URLs or supported files processed by the Geoformatting Service I originally created while developing MART.
The final phase connected the map more closely to real-world water-level information. The slider can display sea-level-rise and high-tide projections alongside recorded levels from historic floods. Because each NOAA station has a different local reference point, the application detects when the map has moved into another station's area and offers to update the slider accordingly. Users can also switch stations directly and view a compact area chart showing projected sea-level rise over time.
Technical approach
Early in the project, ESRGC obtained the source code for NOAA's two viewers so we could evaluate their approaches rather than recreate them blindly. The central architectural decision was how to render inundation. NOAA's Sea Level Rise Viewer selects a separate layer for each six-inch interval, while the Lake Level Viewer combines a base-water-level hillshade with coastal depth data to support increments as small as 0.01 feet.
The second approach offered finer resolution, but DNR needed disconnected flood areas rendered distinctly and the project had a fixed delivery window. I chose the layer-based model because it met the program's requirements with lower implementation risk. That tradeoff let me focus development time on the Maryland-specific context, analysis tools, and overall usability rather than forcing a more complex data model into the schedule.
I built MCFE as a React single-page application with Vite. The product needed neither server-side rendering nor substantial routing, and it would ultimately be deployed as a static site on DNR infrastructure, so a larger framework would have added complexity without a clear benefit. I used Bun during development for its fast package-management and build workflow, while keeping the production artifact straightforward to host.
OpenLayers powers the mapping interface. Starting with the same library used by NOAA made it easier to study and adapt useful interaction patterns, but the project also demonstrated how well OpenLayers handles sophisticated controls, measurements, custom layers, and projections. It has since become my preferred foundation for advanced web-mapping work.
Zustand coordinates application state, from active layers and opacity to user-uploaded datasets. I also persist essential map state—such as the center, zoom, and selected water level—in the URL, allowing users to share a link that opens to the same view without introducing accounts or server-side storage.
I used the project to develop a more expressive interaction style as well. Drawing on Emil Kowalski's animations.dev course, I added restrained transitions and motion to controls throughout the interface. The goal was not decoration, but making a complex browser-based tool feel responsive and cohesive without distracting from the map.
Challenges and lessons
The most important challenge was balancing analytical power with clarity. MCFE combines many layers, measurements, water-level scenarios, station-specific values, and user-supplied data in one interface. Building each feature was only part of the work; the larger task was deciding when to reveal it, how controls should relate to one another, and how the application could explain changes—such as switching the active tide station—without surprising the user.
The project also reinforced the value of choosing architecture around actual requirements rather than theoretical capability. The highest-resolution inundation model was not automatically the best fit. By comparing NOAA's implementations, understanding DNR's priorities, and making the tradeoff explicit, I delivered the required behavior within the timeline while preserving room for a polished user experience.
MCFE strengthened my ability to turn specialized GIS data into a focused public-facing product. It brought together technical research, stakeholder requirements, geospatial application design, state management, data interoperability, and interface craft—and resulted in a tool that makes complex coastal-flood information easier to explore and share.